The basics of a farmer’s business is to produce saleable commodities (milk, meat, wool etc.) from pastures grown from soil fertility (natural capital).
It is common that laboratory reports on samples from pastures under varying management will have similar figures on ME, Carbohydrates, Protein, Fat, and so on, as measured on a Dry Matter basis.
When we look at the actual amount of that dry matter that the cow can eat along with the moisture, referred to as fed feed, only now we can see how much ME the cow is actually able to obtain as she grazes.
To demonstrate, using an actual example, this farmer uses the Qlabs fertiliser programme to balance and optimise soil fertility in one paddock, with superphosphate and urea being applied on an adjacent control paddock.
The following figures are mind-blowing, and the principles apply no matter what type of farming you are doing.
Scenario (‘as fed’ refers to pasture as it stands in the paddock)
Take a 450kg Jersey/Friesian cross cow producing 2 kg milk solids a day, maintaining its body weight and walking three kilometres on flat country.
If a farmer has available one hundred tonnes of grass as fed, that has the quality of the Qlabs paddock, he/she can fully feed 1045 cows/day/100T.
Now if a farmer has available one hundred tonnes of grass as fed, that has the quality of the control paddock, she/he can only fully feed 681 cows/day/100T.
If you are in the business of growing grass to feed productive animals, you have to ask yourself ‘which one hundred tonnes of pasture would you prefer to grow?’
Many of the lab test results, from full feed test reports have very similar measurements between these two paddocks e.g. both have 11 MJ/Kg on a Dry Matter basis. The significant exceptions occur once the test results are converted from DM to as fed for DM percentage and ME intakes.
For the Qlabs sample these are 20.3% DM and 2.3mj/kg as fed. For the control sample they are 13.4% DM and 1.5mj/kg as fed. This is an increase in favour of the Qlabs sample of 51.5% for DM and 53.3% mj/kg as fed! This is a huge increase in nutrient density. Yet both samples have a ME of approximately 11mj/kg on a DM basis. This is where the process of allocating pasture on a DM basis can cause major discrepancies in how well we are feeding animals. The reality of it is farmers actually allocate pasture on a visual basis. Both the animal and the farmer practise consumption and allocation respectively on a wet matter or as fed basis. This process does not vary whether you are using a gumboot to judge the height of the pasture or a glance over the fence. By far the majority of decisions are made day to day , on the spot and are based on moving the animals into the paddock with the most feed.
Now let’s take these redband gumboots to illustrate the reality.
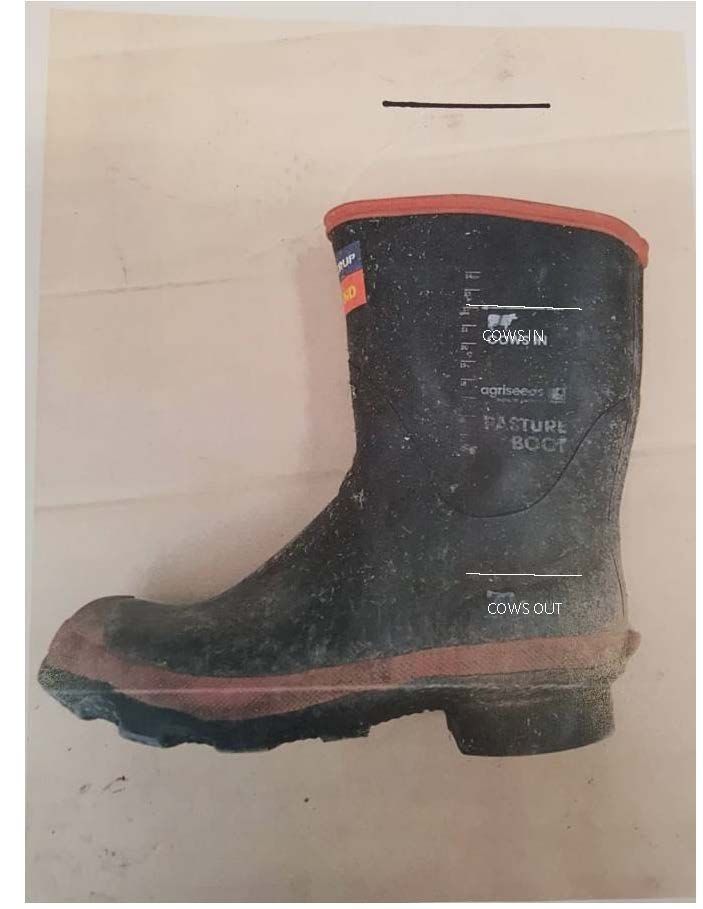
If the Qlabs paddock is to be grazed at the ‘cows in’ mark and grazed down to the ‘cows out’ mark, then the superphosphate/Nitrogen paddock would have to be up to the black line above the gumboot, i.e. 50% higher, to provide the same nutrient value and grazing residuals. That’s an awful lot of extra pasture needed.
Let’s assume the farmer decides that both of these paddocks are ready to graze at the ‘cows in’ height. The cows in the Qlabs paddock would graze down and leave the appropriate residual. However, the cows in the control paddock would graze down to the ‘cows out’ height and still be hungry. They would then continue to graze right down to the dirt and would still not be fully fed. This paddock would now be overgrazed, leaving the pasture stressed and struggling to recover. The ensuing slow recovery rate will require another application of Nitrogen to compensate for the overgrazing. This scenario plays out time and time again. It manifests itself in the form of agro- ecological ‘false economy’. What you see as lush green grass does not necessarily align with the theoretical animal productivity.

